Debugging your code in your browser
2. Pausing execution
When your programming is running in a loop, for example a while, do or for loop or in a callback such as a time-out, interval, event listener or animation, you can pause the programs execution at any time to see it's current state.
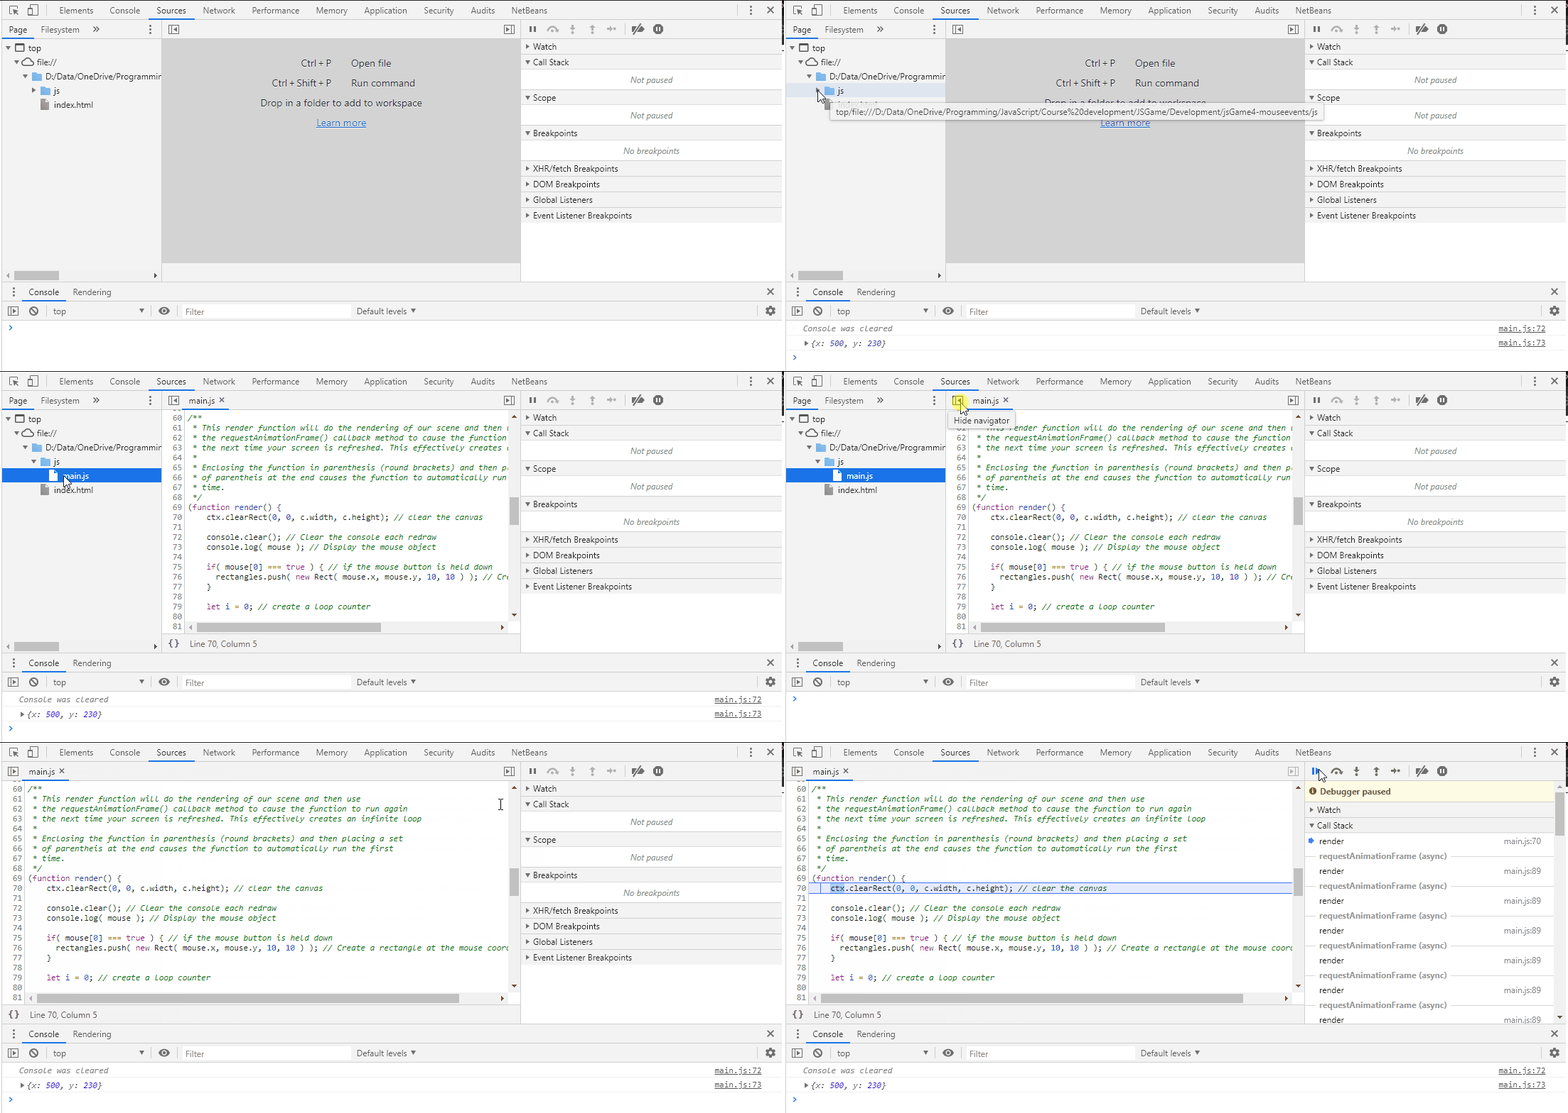
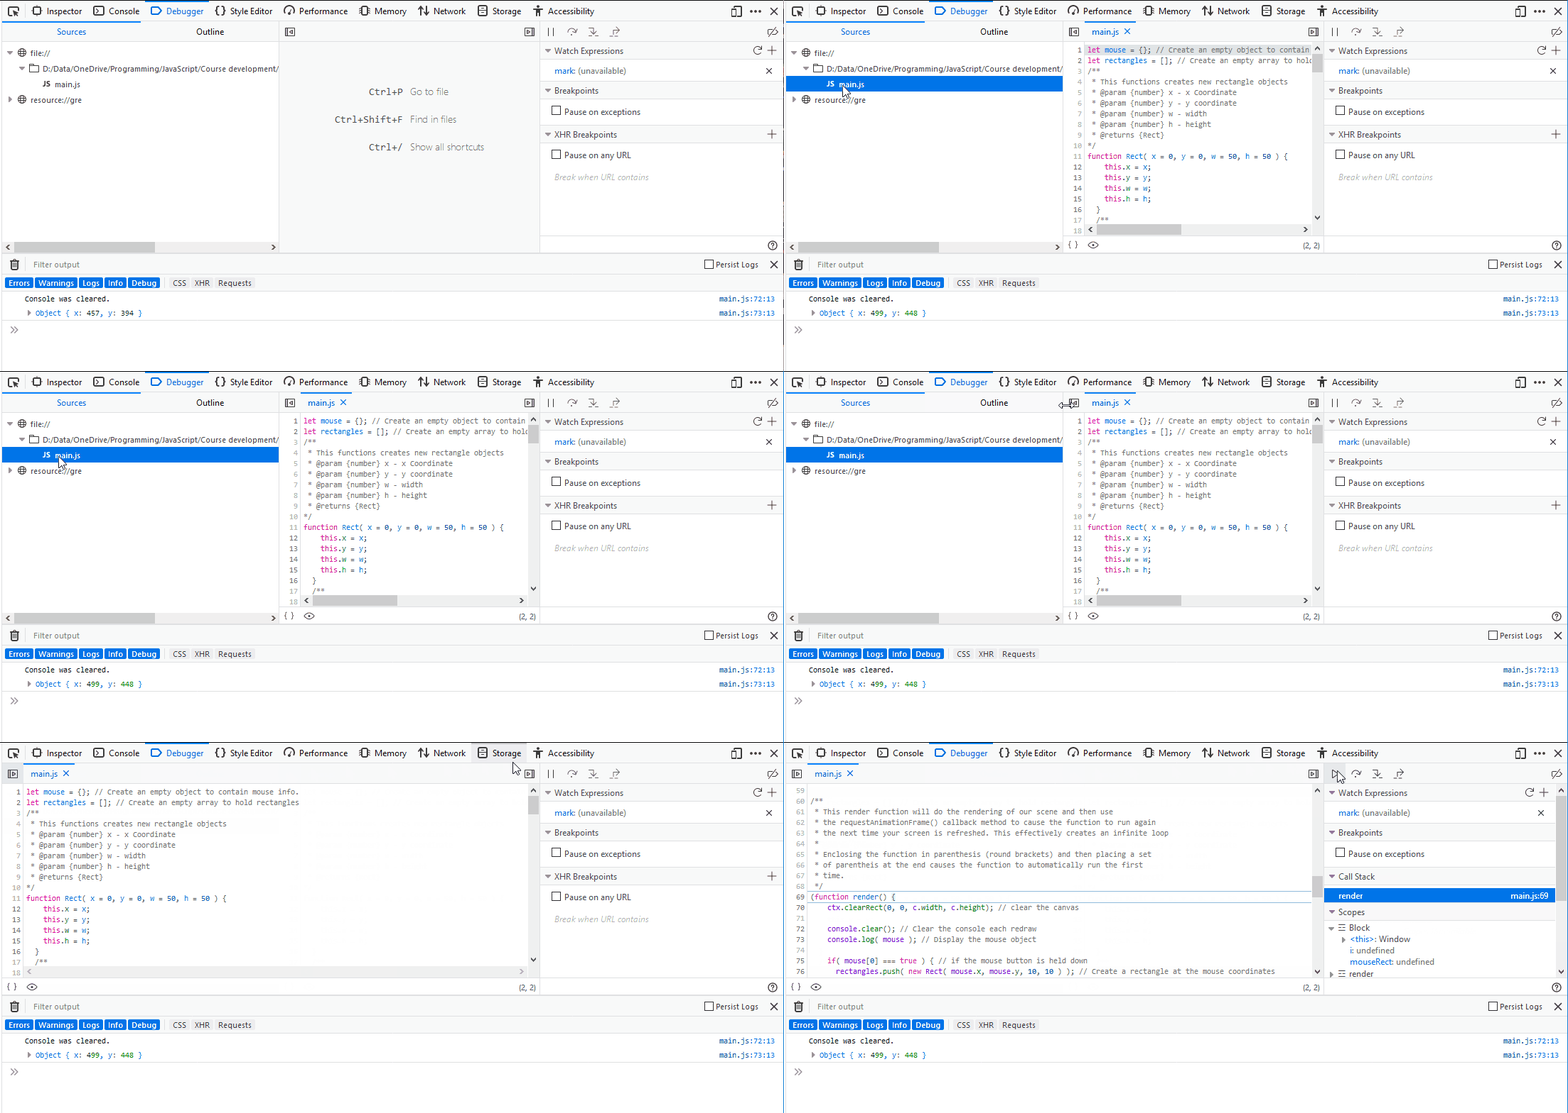
To do this:
- Bring up the developer tools. Usually this is the F12 key.
- Switch to the Debugger tab. This is called Sources in Chrome.
- Locate and open the file from the Navigator. This can then usually be hidden if more room to view the code is needed.
- Finally click the Pause button. It's located in slightly different places depending on the browser and available screen size.
- You can restart by clicking pause again.
See below for animations of Firefox and Chrome.
Chrome

Firefox

See also using break points for how to pause the program automatically when a specific line is reached and how to use the step controls to execute the code one line at a time.