Debugging your code in your browser
1. The Developer tools
1.3. Displaying the console
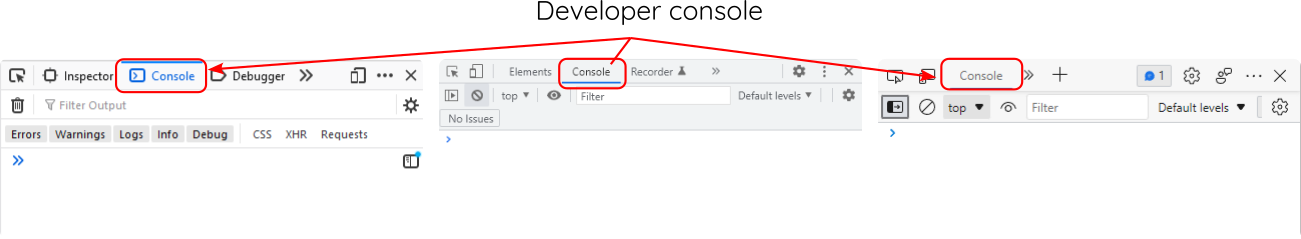
The console is a multi-use tool, displaying errors and messages and also letting you type in programming code, amongst other things. It is its own tool and has a tab to access it, shown left to right below in Chrome, Firefox and Edge:
We'll look at specific things the console is used for in both the various Web Design and JavaScript courses as well as in some other chapters of this book, however, its worth mentioning that the console can also be shown as a component in other developer tools.
Shown below is the Elements developer tools in Chrome. Clicking the Custom tools menu gives you the option to show a console drawer.
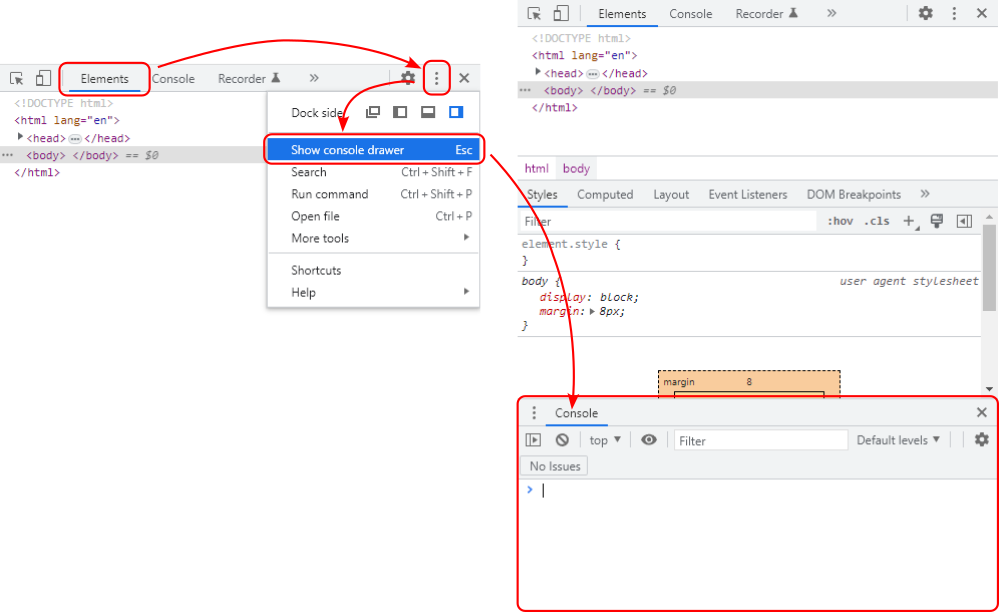
The moment you show the console drawer, you will probably need to resize the components to all fit nicely in the developer tools. The console can be closed at any time from the menu or by clicking the  button in the console drawer.