Debugging your code in your browser
| Site: | Training For Life |
| Course: | Debugging code in your web browser |
| Book: | Debugging your code in your browser |
| Printed by: | Guest user |
| Date: | Sunday, 14 June 2026, 5:53 AM |
Description
This book contains tips and instructions on how to use your web browsers debugging tools. They are mostly the same with just minor differences across the main three browsers: Chrome, Firefox and Edge.
1. The Developer tools
Most web browsers and all of the big four (Chrome, Edge, Safari and Firefox) have built in tools to make possible to track down problems with your web pages, CSS and JavaScript code. The tools are similar in all browsers with just a few changes in layouts and names here and there.
In general, you can display the developer tools in three ways:
- Press the F12 key on your keyboard.
- Press Ctrl+Shift+I keys on your keyboard.
- Right click on the web page and choose Inspect.
As you can see, they all look similar, although on closer look there are some differences. The following pages will first show you how to adjust the developer tools and then how to use them to find and fix errors (called debug) your web pages.
1.1. Moving and resizing the developer tools
The developer tools can be moved to a different edge of the browser window or even into a window of it's own if you have a second or third screen where they can be viewed without getting in the way.
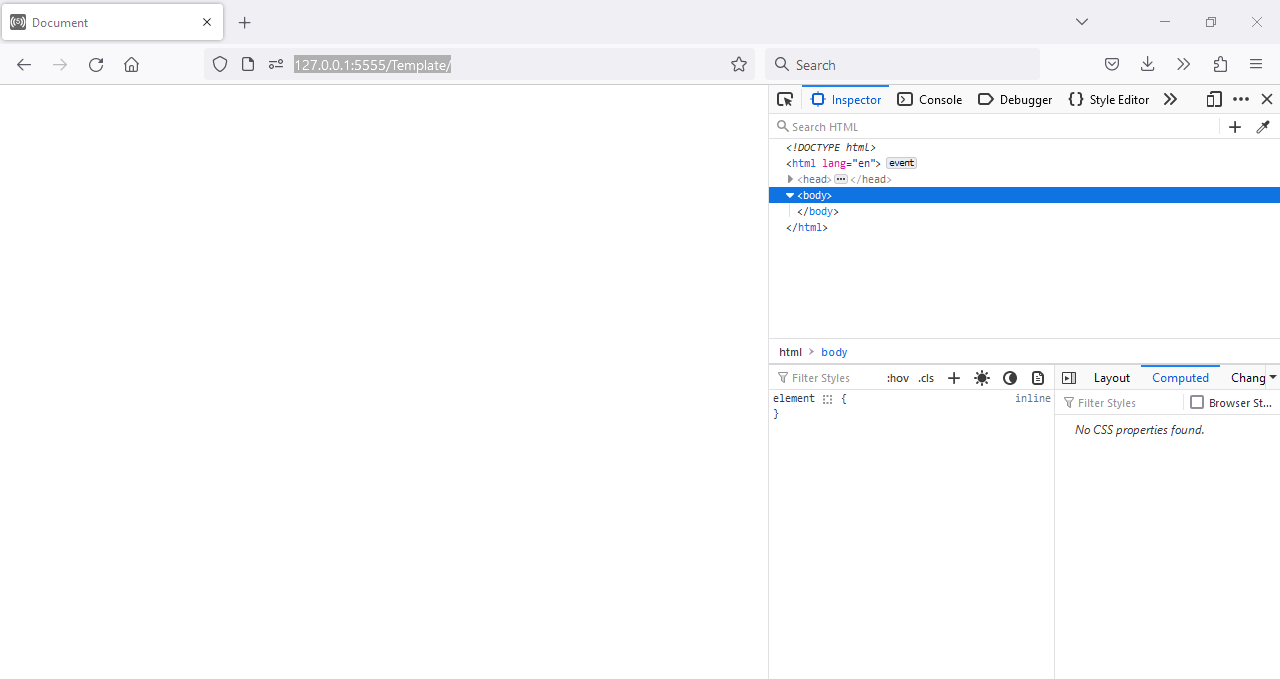
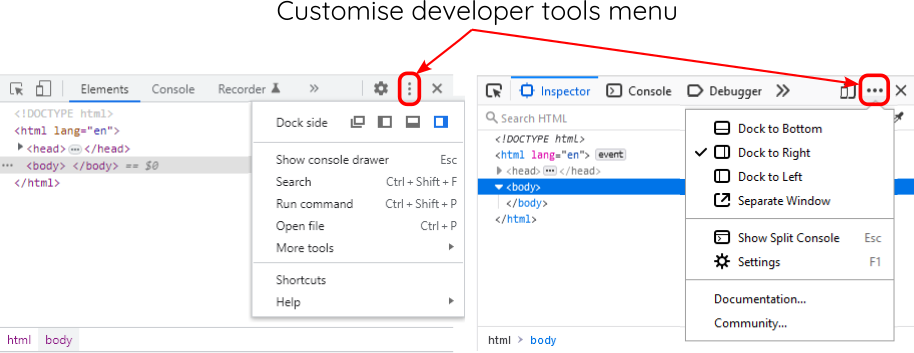
All the browsers developer tools have a menu with access to these settings. You're looking for the 'three dot' or 'Kebab' menu in the developer tools. Show below is Chrome (left) and Firefox (right) and the location of this menu:
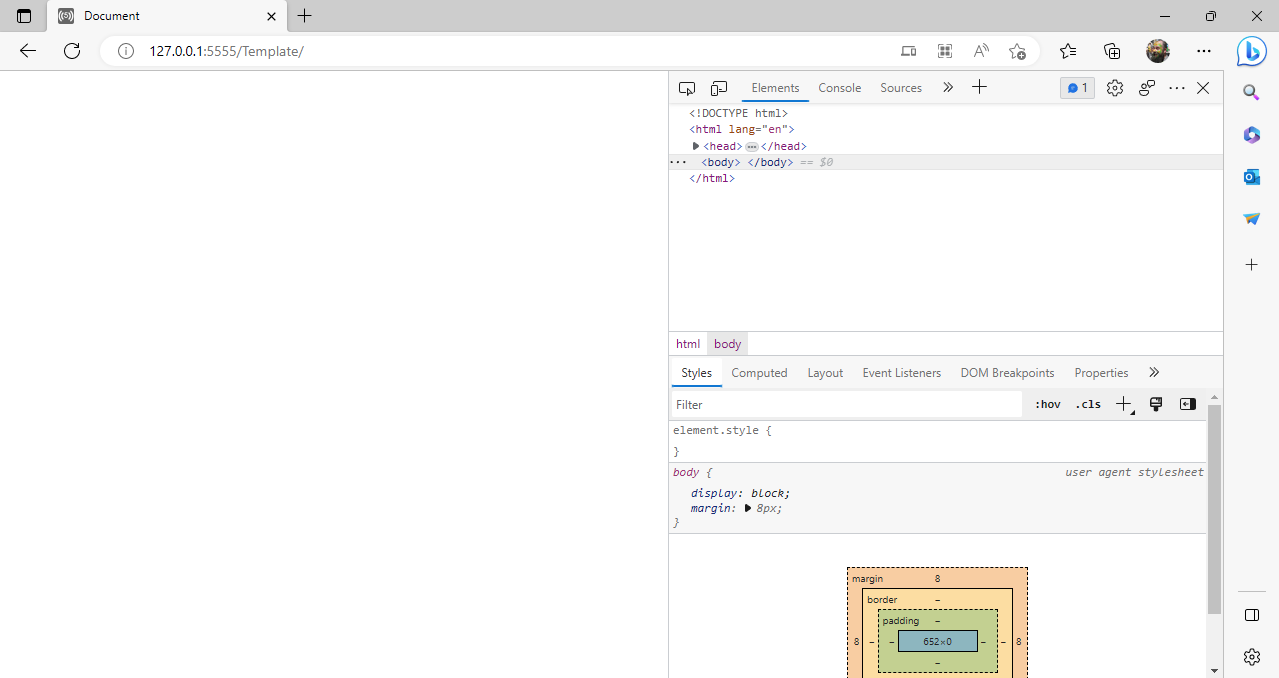
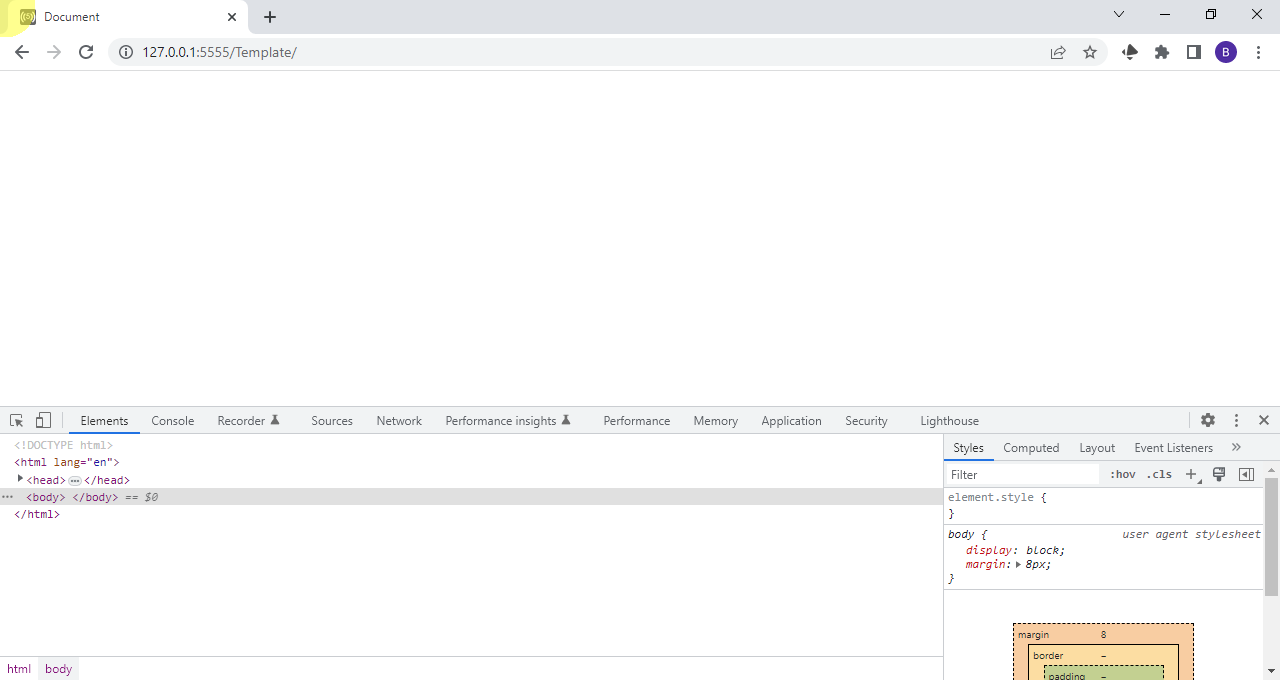
Below is the Chrome developer tools docked to the bottom of the chrome window.
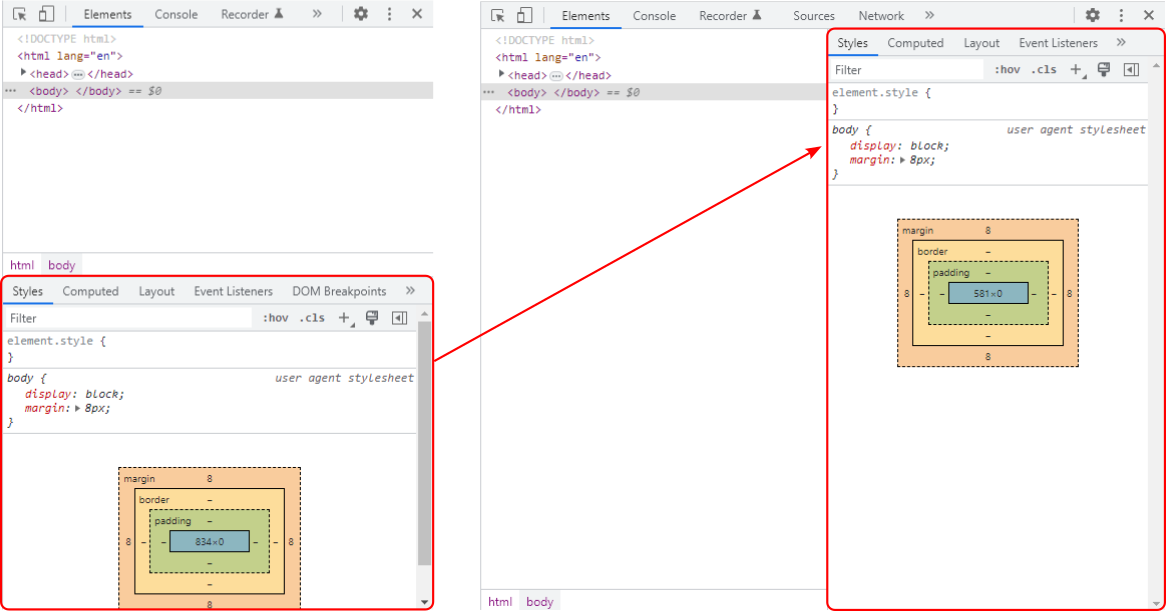
The developer tools can be resized to make them wider or taller by dragging the border of the tools window as shown below. Note that as the tools get larger, some components will automatically rearrange themselves, such as the CSS frame as shown in the example.
1.2. Resizing the developer tool components
In addition to being able to move and resize the developer tools themselves, many of the components inside the developer tools can be changed as well.
As you saw on the previous page, some of these changes happen automatically, such as the CSS frame moving when making the developer tools wider.
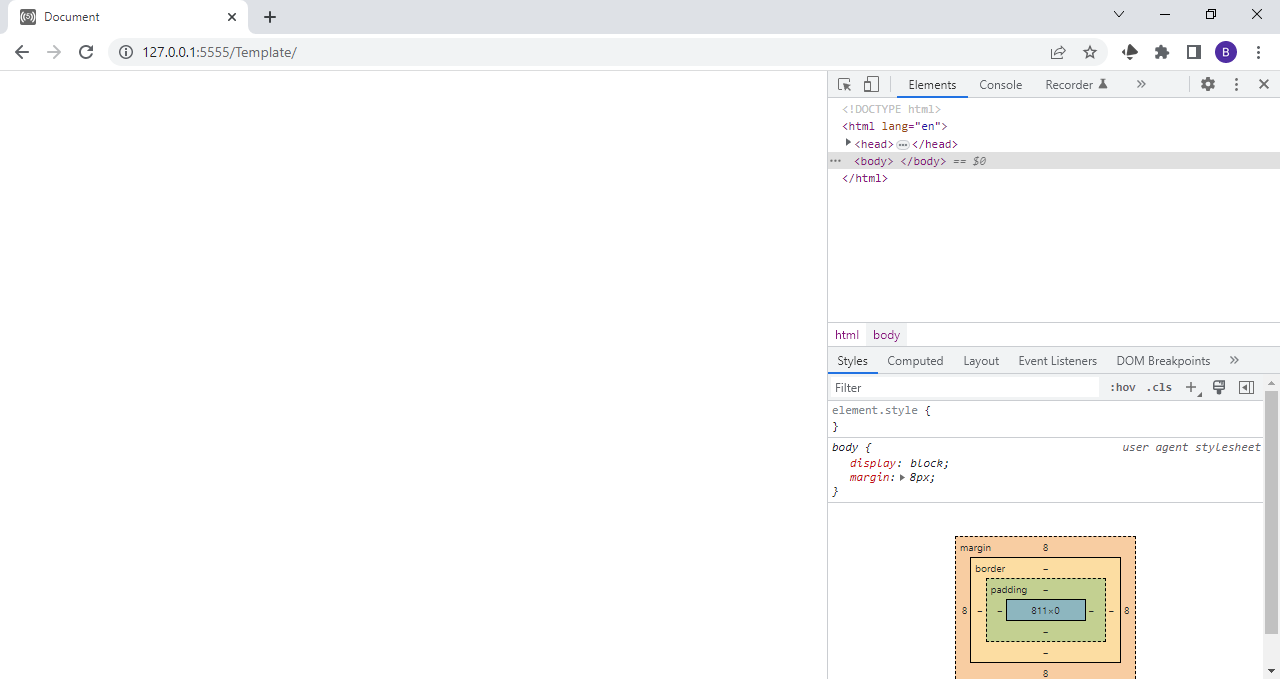
Many of the developer tools are made up of several components, such as Chrome's Elements tools shown here with an HTML and a CSS component. You can resize these by dragging the components border as shown below.
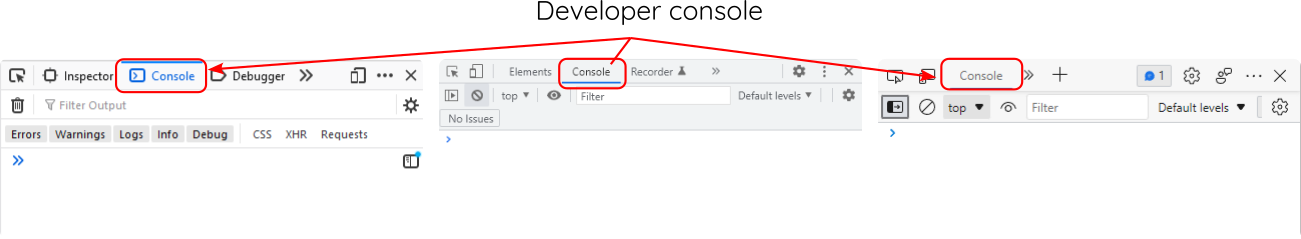
1.3. Displaying the console
The console is a multi-use tool, displaying errors and messages and also letting you type in programming code, amongst other things. It is its own tool and has a tab to access it, shown left to right below in Chrome, Firefox and Edge:
We'll look at specific things the console is used for in both the various Web Design and JavaScript courses as well as in some other chapters of this book, however, its worth mentioning that the console can also be shown as a component in other developer tools.
Shown below is the Elements developer tools in Chrome. Clicking the Custom tools menu gives you the option to show a console drawer.
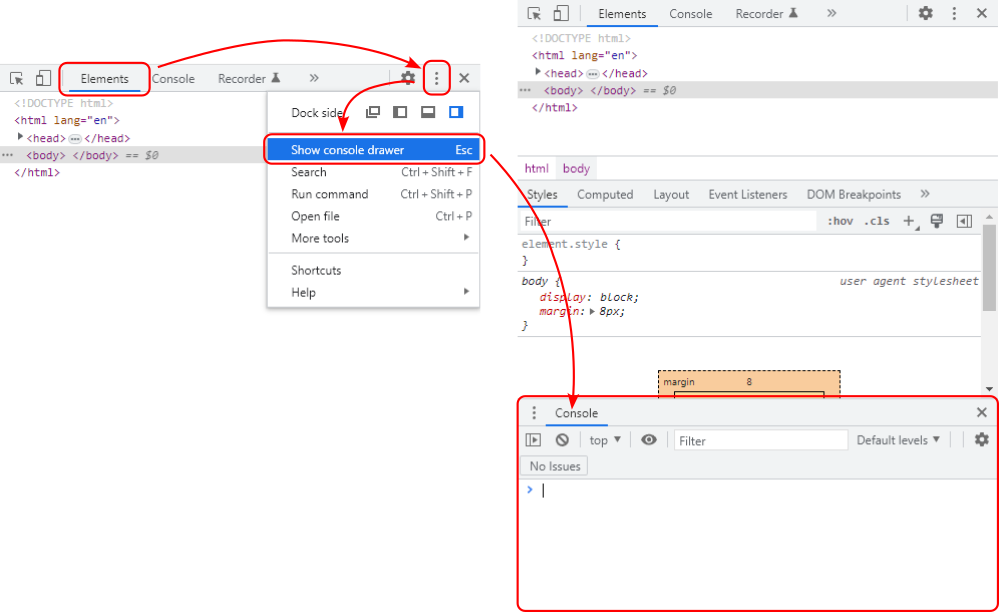
The moment you show the console drawer, you will probably need to resize the components to all fit nicely in the developer tools. The console can be closed at any time from the menu or by clicking the  button in the console drawer.
2. Pausing execution
When your programming is running in a loop, for example a while, do or for loop or in a callback such as a time-out, interval, event listener or animation, you can pause the programs execution at any time to see it's current state.
To do this:
- Bring up the developer tools. Usually this is the F12 key.
- Switch to the Debugger tab. This is called Sources in Chrome.
- Locate and open the file from the Navigator. This can then usually be hidden if more room to view the code is needed.
- Finally click the Pause button. It's located in slightly different places depending on the browser and available screen size.
- You can restart by clicking pause again.
See below for animations of Firefox and Chrome.
Chrome
Firefox
3. Outputting variables to the console
If you do not want to view variables by adding console.log() lines to your code, you can manually output them by typing the variable name directly into the browser console.
To do this:
- Open the developer tools. Usually this is the F12 key.
- Switch to the console tab or the Debugger / Sources tab. If the console is not shown in the Debugger / Sources tab, pressing the Esc key will usually display it.
- Type the variables name into the console and press enter.
- You can usually auto-complete the variable name by pressing enter before you have finished typing.
The example below shows the x and y variables for a rectangle moving diagonally down the screen.
More complex variables such as Arrays and objects can also be displayed.
- Typing their name shows the whole variable which can be expanded to see inside.
- Using a specific index for an array or a specific property for an object will show just that element or property.
The animation below shows an array with 10 elements, each a rectangle object. It then shows element 1 being inspected and finally the fillStyle property of that element.
4. Using a break point
A break point allows you to pause execution on a specific line. This is a great tool to see what the state of a program is at a specific point in its execution.
A break point is similar to pausing the program, but you have greater control over exactly where the program is paused. In addition, you can set a break point then reload the program to pause a program you otherwise couldn't with the pause button.
To do this:
- Bring up the developer tools. Usually this is the F12 key.
- Switch to the Debugger tab. This is called Sources in Chrome.
- Locate and open the file from the Navigator. This can then usually be hidden if more room to view the code is needed.
- Find the line you want to pause on.
- Click the line number to create or remove a break point.
The animation below shows a breakpoint being placed at the top of an animation call back. A variable is output to the console to see it's value then resume is clicked to continue execution. After three repetitions, the breakpoint is removed and resume is clicked so the program executes normally.
5. Adding watch expressions
Instead of using the console to see a variables value, you can add watch points to watch a variable over the course of the program. The only downside to these is that the program must be paused, by using the pause button or a break point for them to update.
- Open the Debugger / Sources tab of the development tools.
- In the Watch Expressions section of the Debugger (highlighted in the animation below) add in your values to watch. They will have the values of the instant the watch was added and will not update again until the program is paused.
- Pause the program by clicking the pause button or adding a break point. This will update the watches to their current values.
- Clicking resume will continue execution until the program is paused again (either by reaching another or the same breakpoint or clicking pause), which will update the watches again.
myArray[0].x * 5 or myObj.angle * Math.PI / 180 can be added as watches.
6. Stepping: executing one line at a time
When a program is paused you have access to three additional buttons next to the pause / resume button. They are:
- Step into. Execute the current line of code and move to the next line of code. This may take you into a different scope, such as a loop or even another sub procedure.
- Step over. Execute the current line and move to the next line of code within the current scope. This skips over loops, branches and procedure calls.
- Step out. Steps out of the current procedure back into the previous scope. This is useful to get out of a scope you've accidentally stepped into.