Debugging code in your web browser
This book contains tips and instructions on how to use your web browsers debugging tools. They are mostly the same with just minor differences across the main three browsers: Chrome, Firefox and Edge.
4. Using a break point
A break point allows you to pause execution on a specific line. This is a great tool to see what the state of a program is at a specific point in its execution.
A break point is similar to pausing the program, but you have greater control over exactly where the program is paused. In addition, you can set a break point then reload the program to pause a program you otherwise couldn't with the pause button.
To do this:
- Bring up the developer tools. Usually this is the F12 key.
- Switch to the Debugger tab. This is called Sources in Chrome.
- Locate and open the file from the Navigator. This can then usually be hidden if more room to view the code is needed.
- Find the line you want to pause on.
- Click the line number to create or remove a break point.
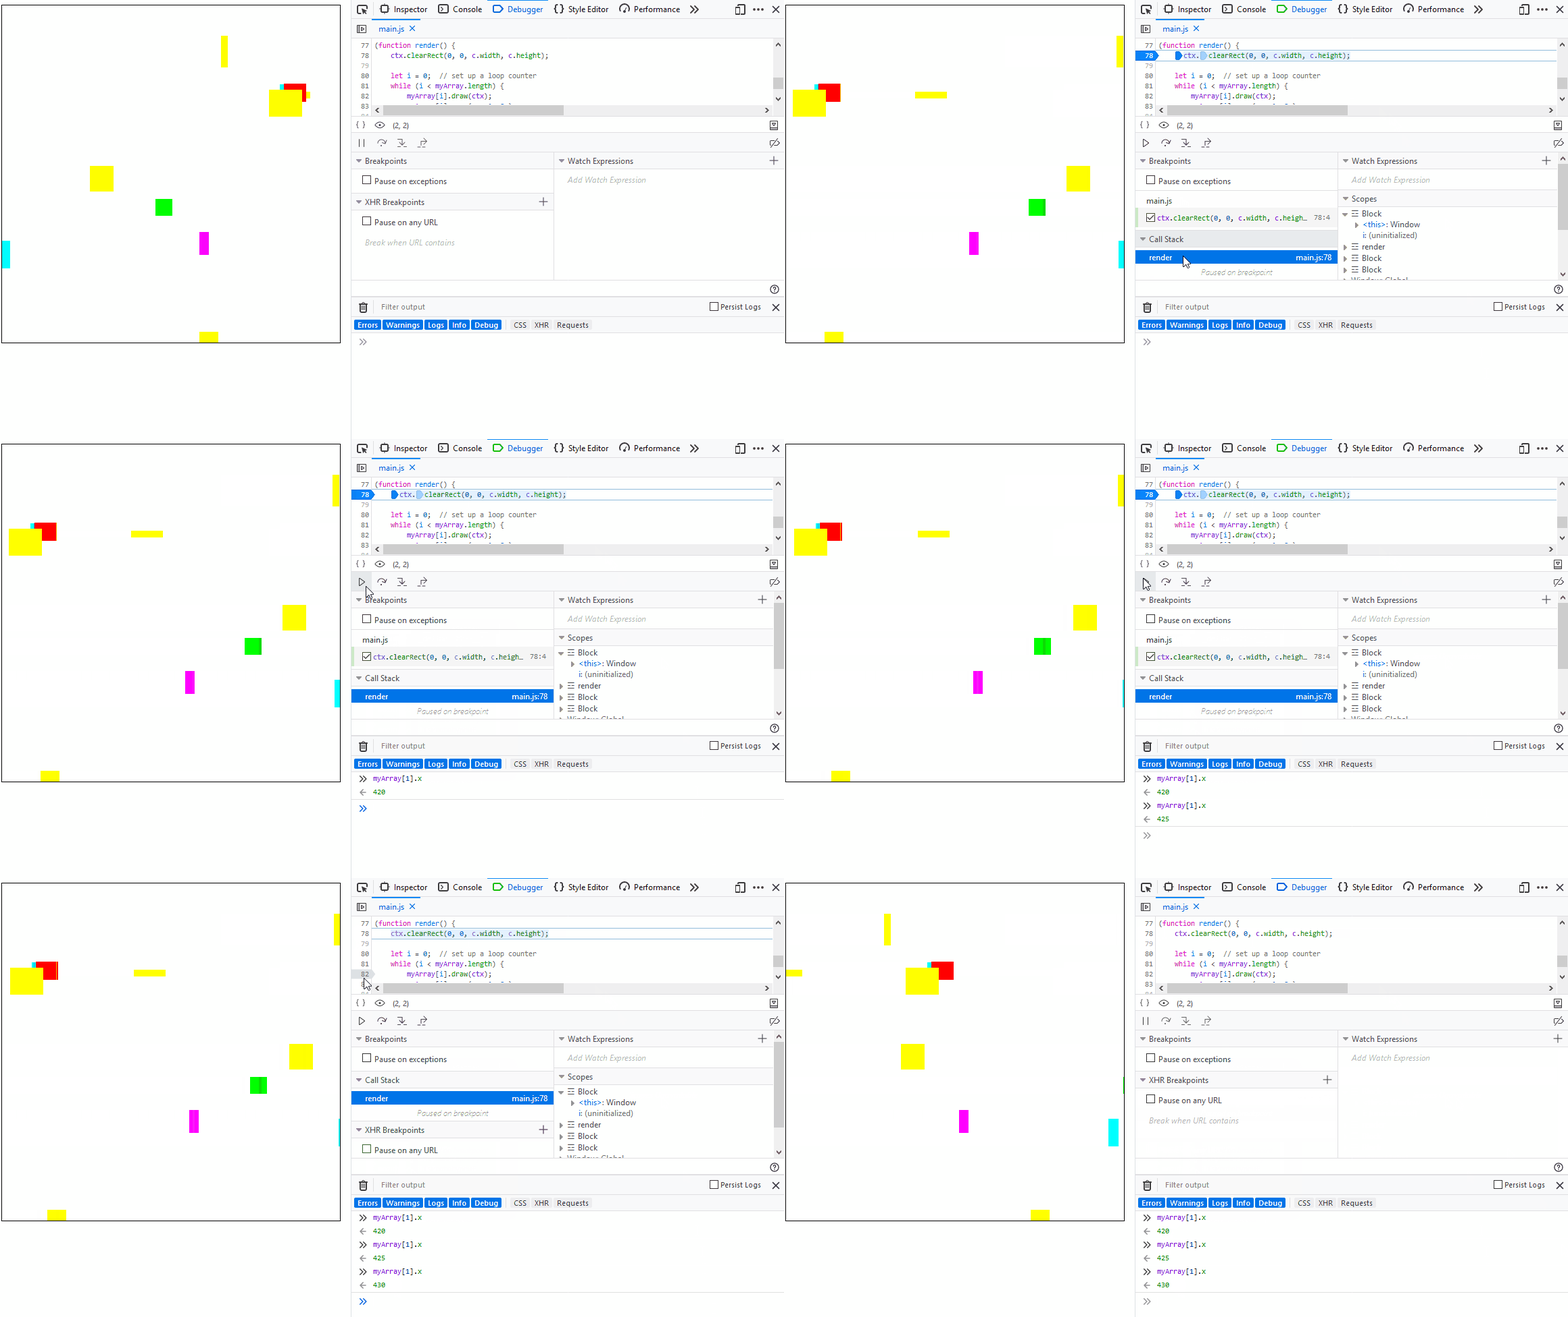
The animation below shows a breakpoint being placed at the top of an animation call back. A variable is output to the console to see it's value then resume is clicked to continue execution. After three repetitions, the breakpoint is removed and resume is clicked so the program executes normally.

