
Debugging code in your web browser
This book contains tips and instructions on how to use your web browsers debugging tools. They are mostly the same with just minor differences across the main three browsers: Chrome, Firefox and Edge.
1. The Developer tools
Most web browsers and all of the big four (Chrome, Edge, Safari and Firefox) have built in tools to make possible to track down problems with your web pages, CSS and JavaScript code. The tools are similar in all browsers with just a few changes in layouts and names here and there.
In general, you can display the developer tools in three ways:
- Press the F12 key on your keyboard.
- Press Ctrl+Shift+I keys on your keyboard.
- Right click on the web page and choose Inspect.
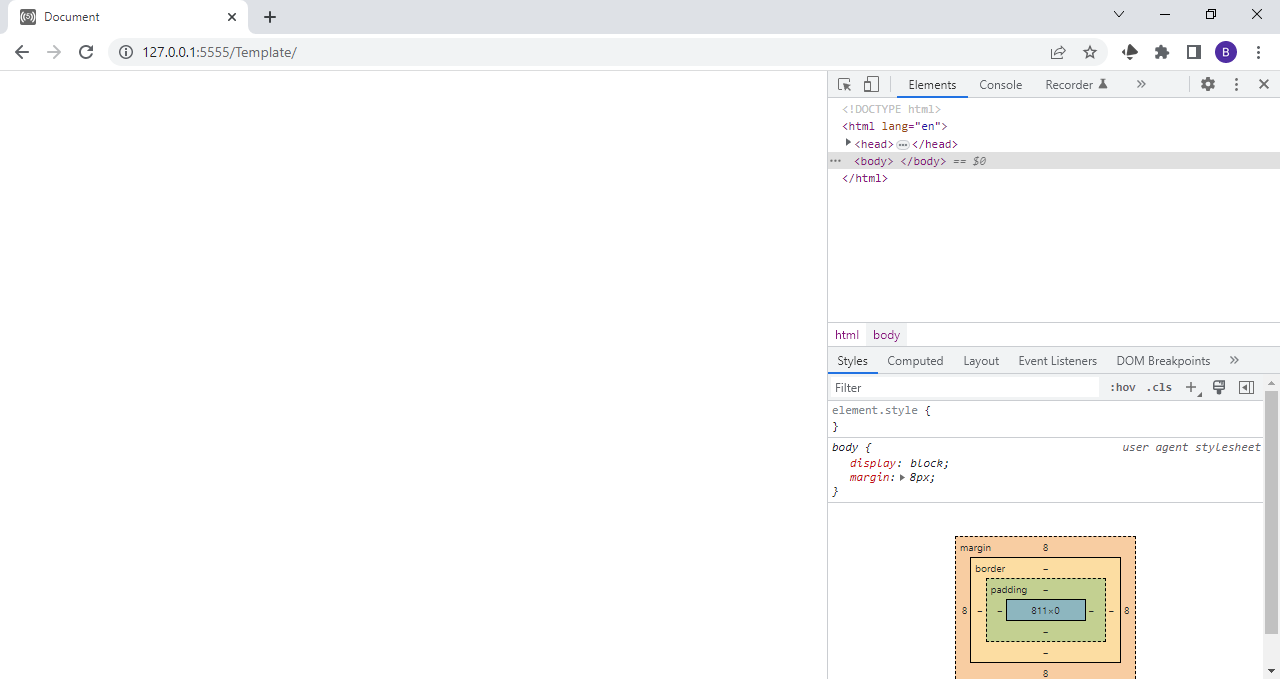
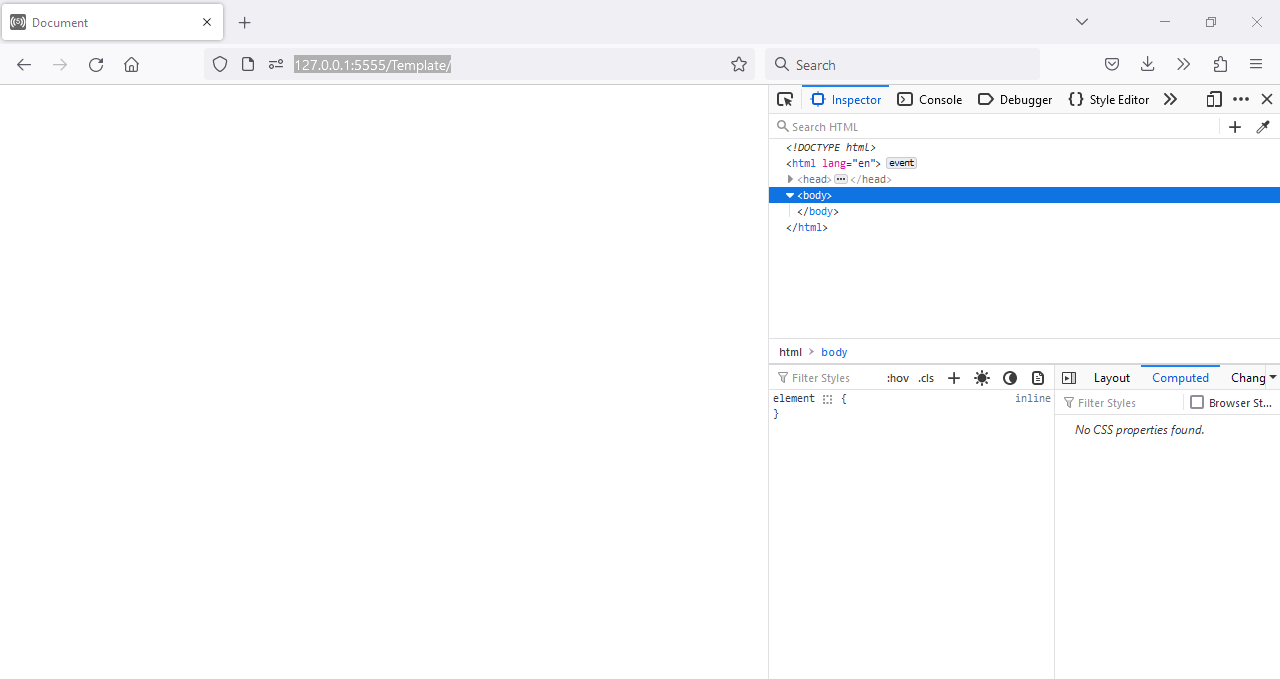
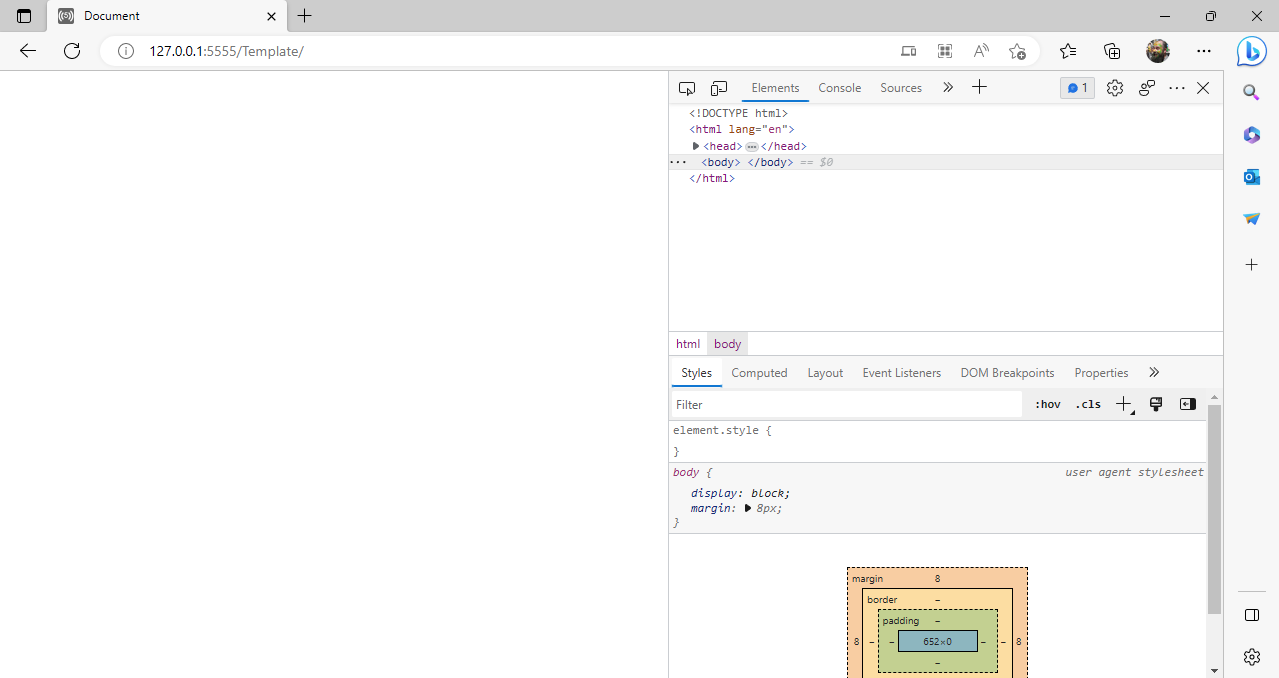
As you can see, they all look similar, although on closer look there are some differences. The following pages will first show you how to adjust the developer tools and then how to use them to find and fix errors (called debug) your web pages.