Debugging code in your web browser
Completion requirements
This book contains tips and instructions on how to use your web browsers debugging tools. They are mostly the same with just minor differences across the main three browsers: Chrome, Firefox and Edge.
3. Outputting variables to the console
If you do not want to view variables by adding console.log() lines to your code, you can manually output them by typing the variable name directly into the browser console.
💡 If you're going to keep viewing the same variable over and over as the program executes, you may want to consider setting a watch on the variable.
⚠ You can manually enter a variable into the console only while the program is still executing, either because it is in a call back loop of some kind or because it is paused.
If you need to see these variables on a program that finishes executing quickly, you should use a break point to pause execution.
To do this:
- Open the developer tools. Usually this is the F12 key.
- Switch to the console tab or the Debugger / Sources tab. If the console is not shown in the Debugger / Sources tab, pressing the Esc key will usually display it.
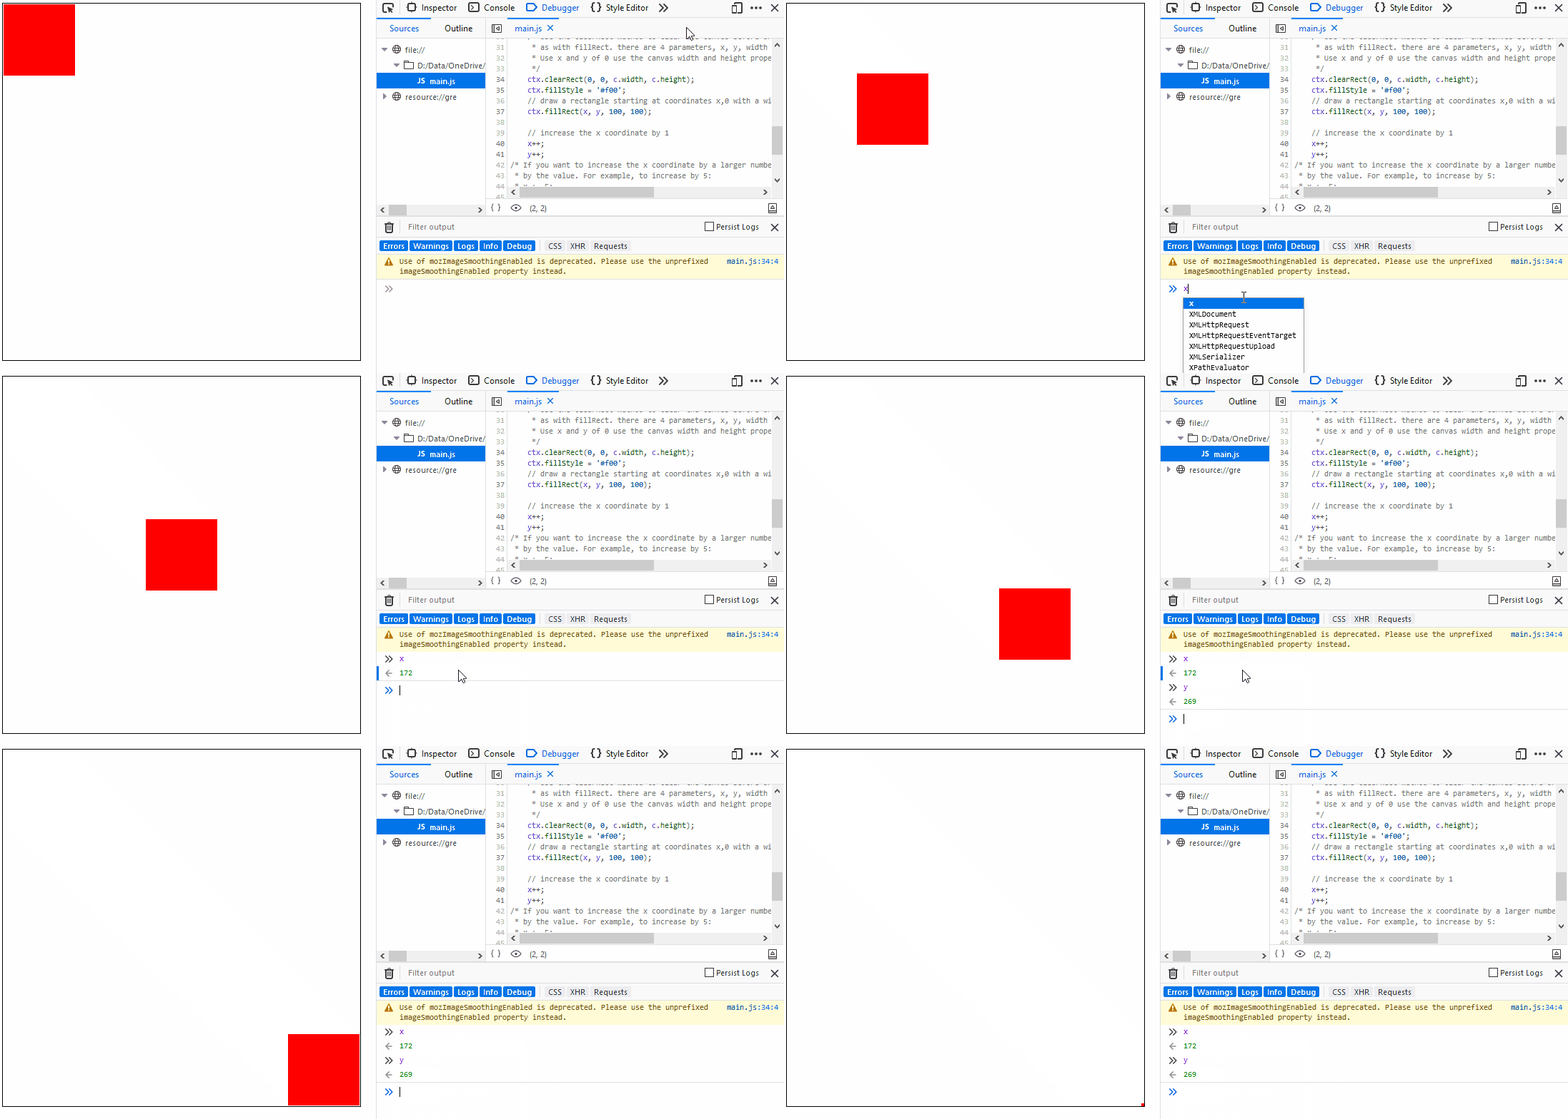
- Type the variables name into the console and press enter.
- You can usually auto-complete the variable name by pressing enter before you have finished typing.
The example below shows the x and y variables for a rectangle moving diagonally down the screen.

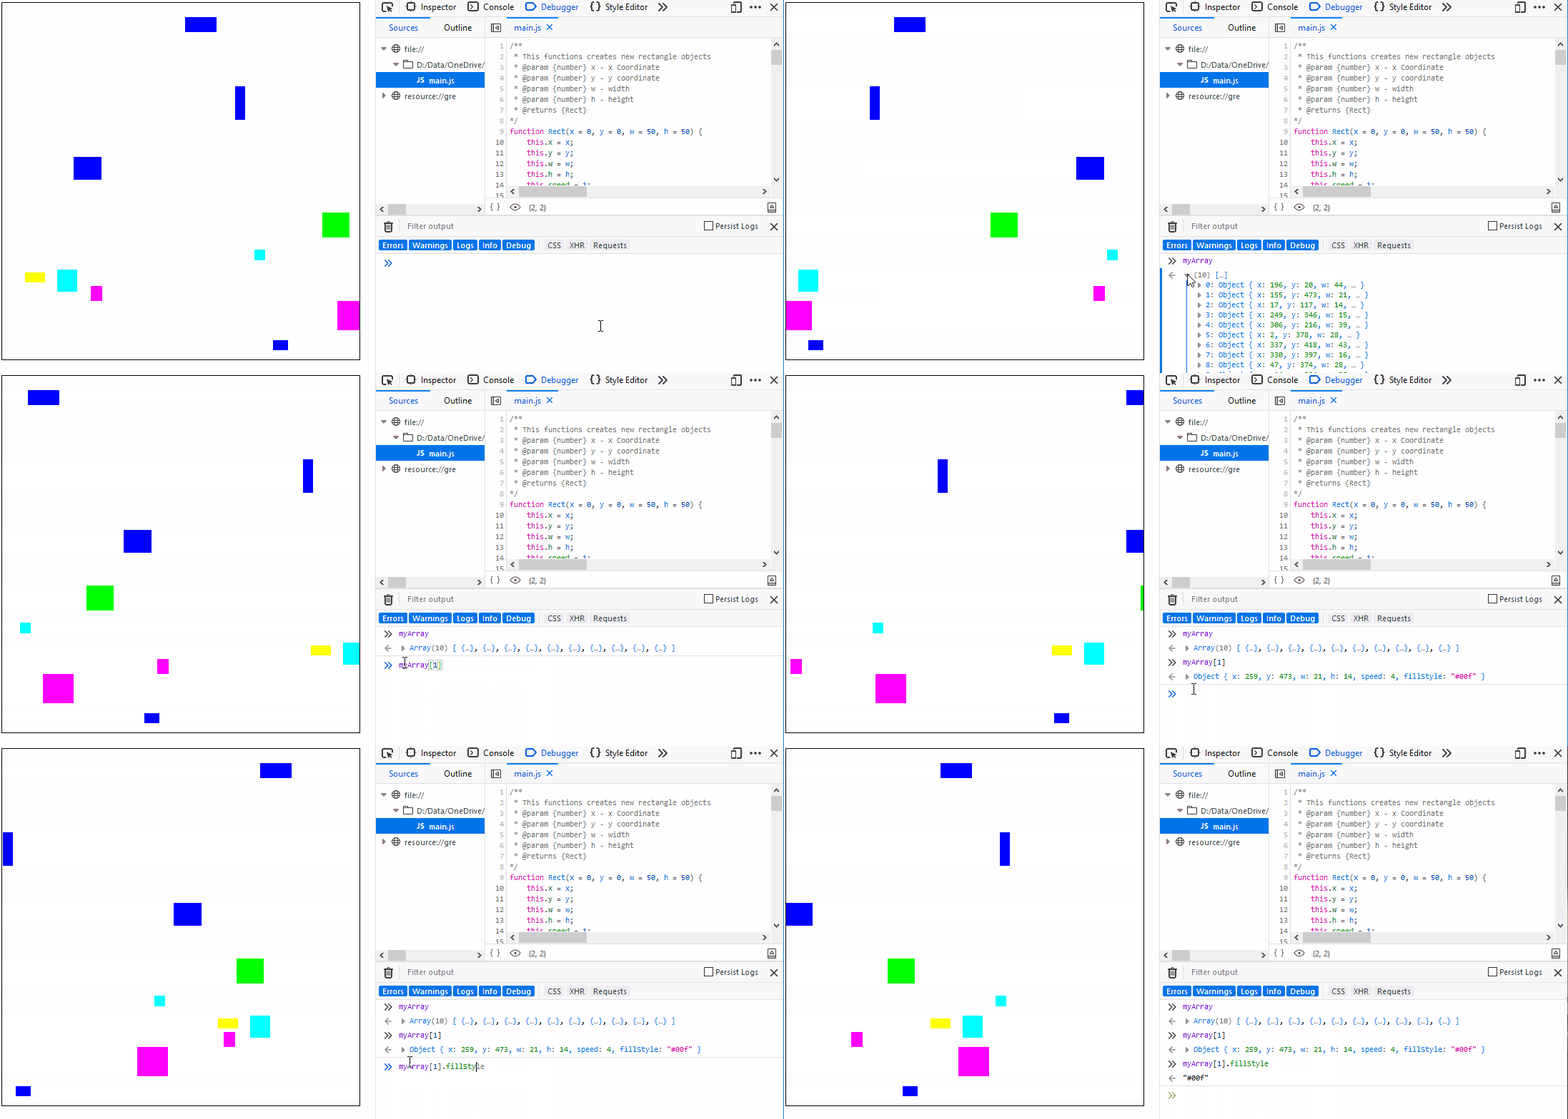
More complex variables such as Arrays and objects can also be displayed.
- Typing their name shows the whole variable which can be expanded to see inside.
- Using a specific index for an array or a specific property for an object will show just that element or property.
The animation below shows an array with 10 elements, each a rectangle object. It then shows element 1 being inspected and finally the fillStyle property of that element.

