Debugging code in your web browser
Completion requirements
This book contains tips and instructions on how to use your web browsers debugging tools. They are mostly the same with just minor differences across the main three browsers: Chrome, Firefox and Edge.
5. Adding watch expressions
Instead of using the console to see a variables value, you can add watch points to watch a variable over the course of the program. The only downside to these is that the program must be paused, by using the pause button or a break point for them to update.
- Open the Debugger / Sources tab of the development tools.
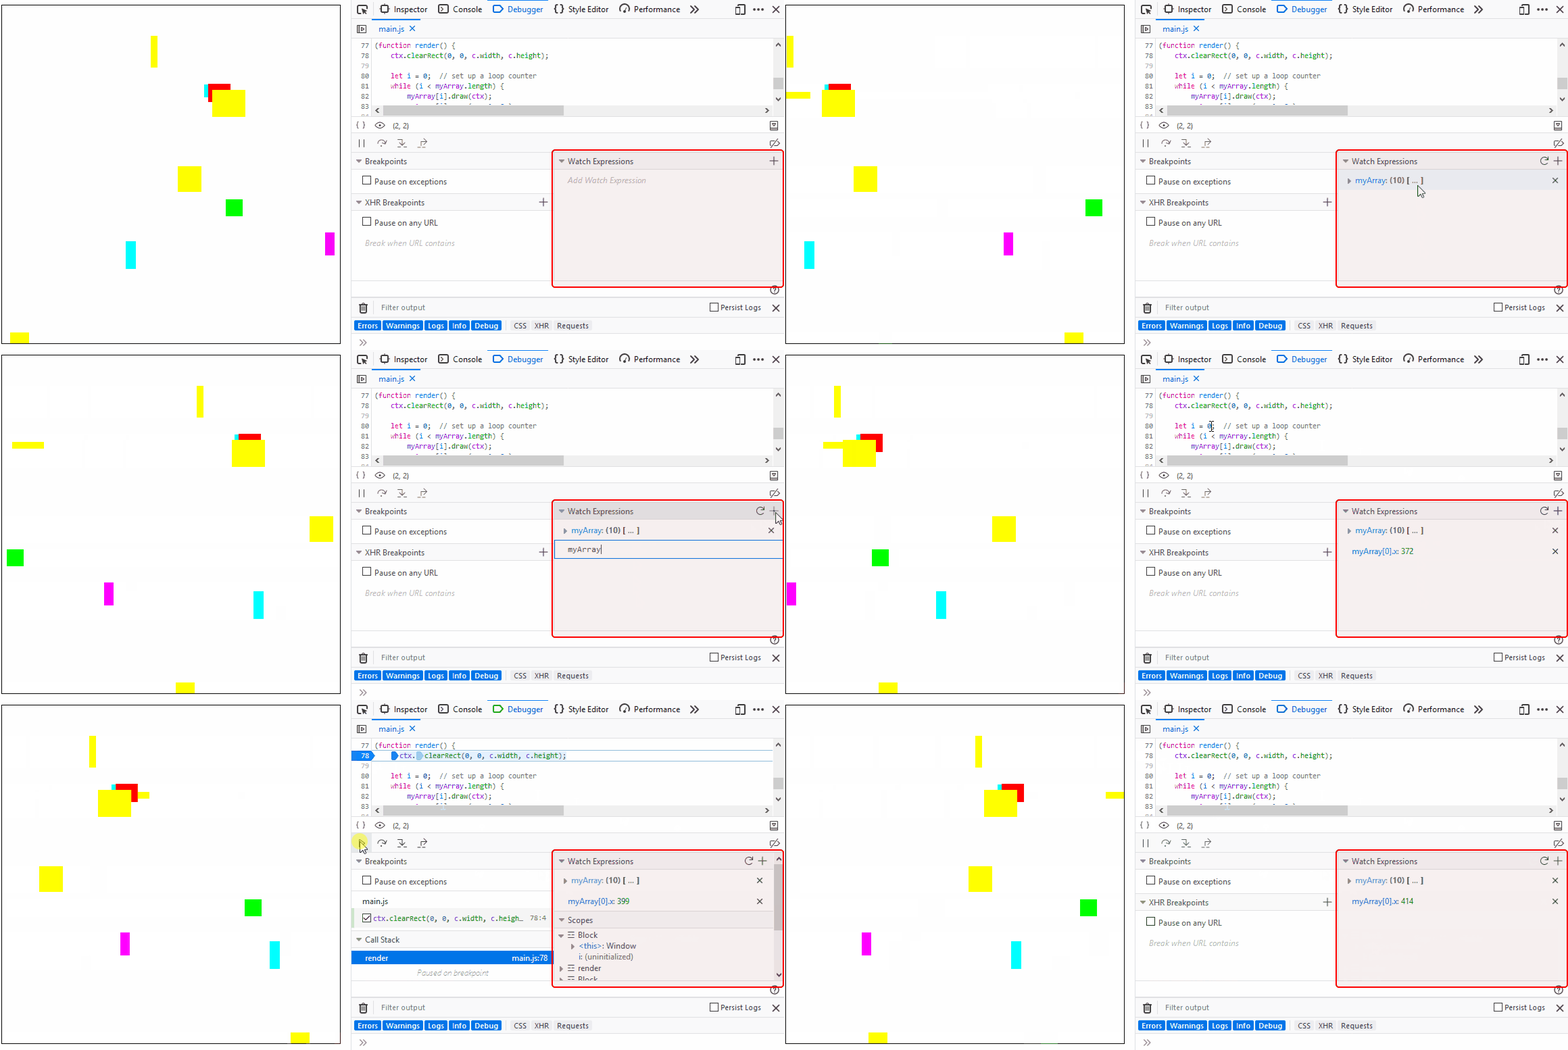
- In the Watch Expressions section of the Debugger (highlighted in the animation below) add in your values to watch. They will have the values of the instant the watch was added and will not update again until the program is paused.
- Pause the program by clicking the pause button or adding a break point. This will update the watches to their current values.
- Clicking resume will continue execution until the program is paused again (either by reaching another or the same breakpoint or clicking pause), which will update the watches again.

💡 Watches are expressions, not just variables. This means full expressions such as
myArray[0].x * 5 or myObj.angle * Math.PI / 180 can be added as watches.
